Every acquisition. One live dashboard.

Consolidated financial reporting for groups that grow by acquisition. Connected to the accounting systems your entities already use.

No system changes. Each new acquisition connected in days.
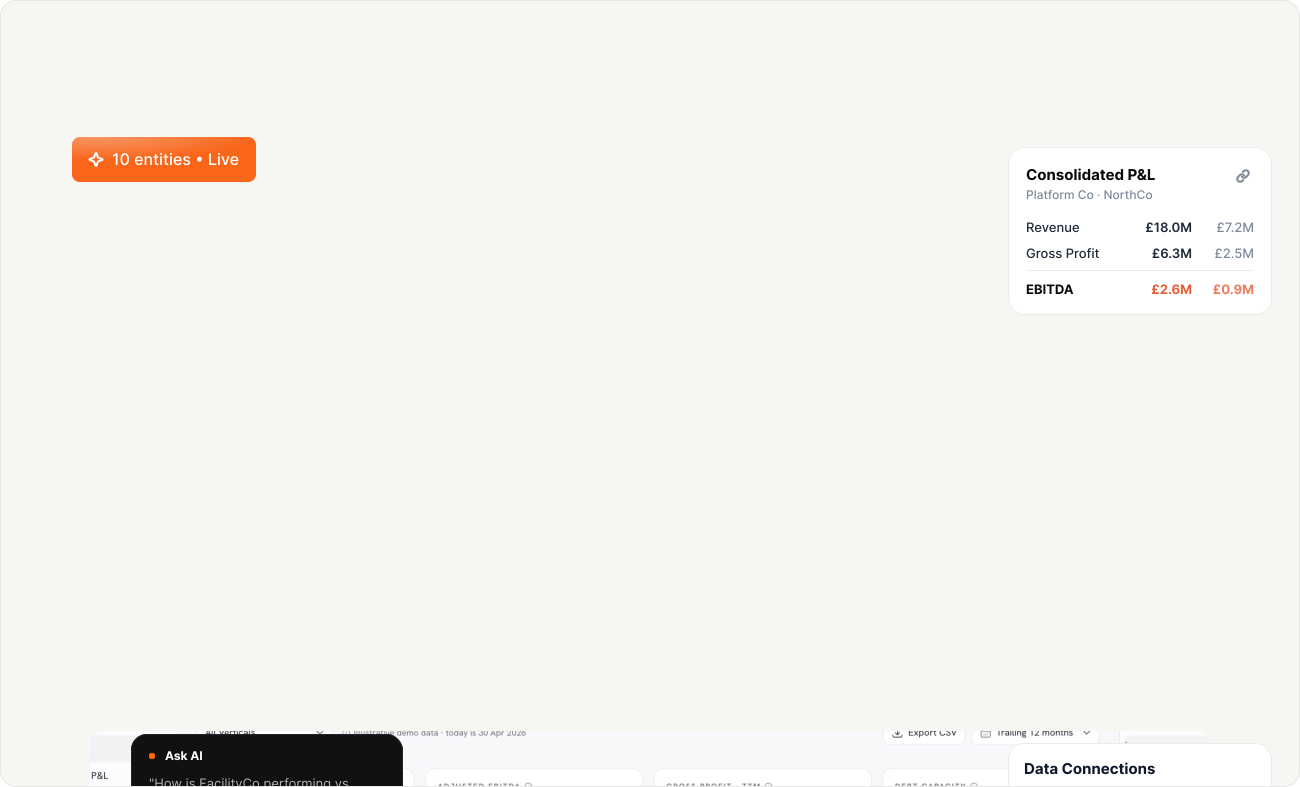
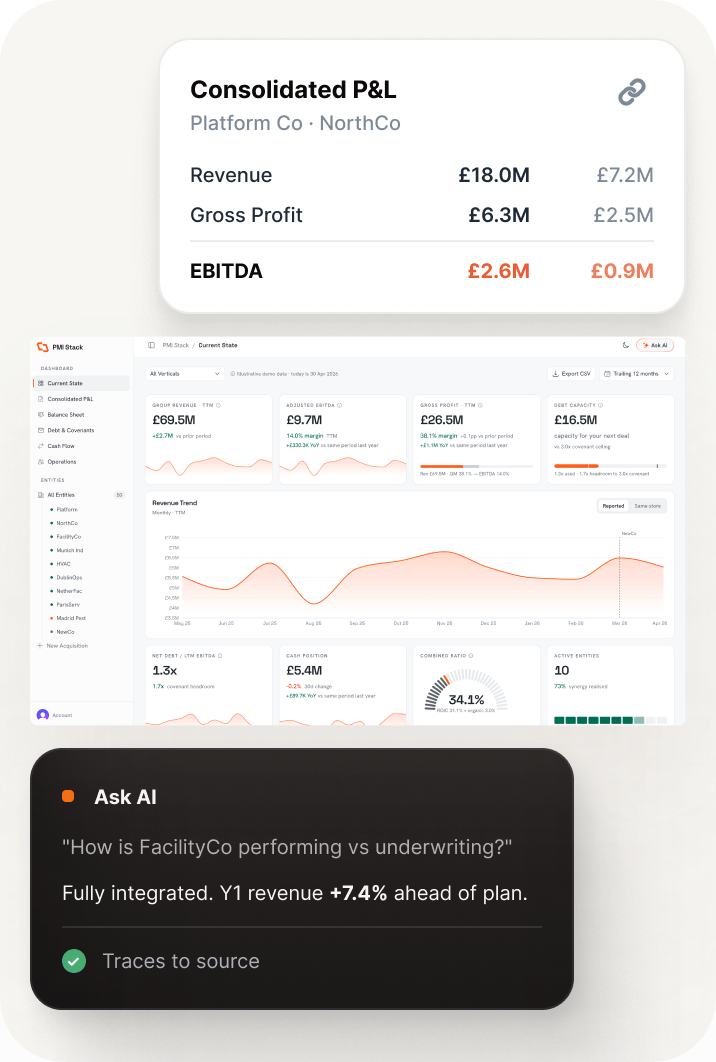
PMI Stack dashboard showing a consolidated P&L, live data connections and an AI answer traced to source across a 10-entity groupConsolidated P&L card, live dashboard and Ask AI answer
200+
pre-built connectors
finance layer by
RIVR8
every figure
Auditable by design
sponsor of
RollUpEurope

One spreadsheet holding it together
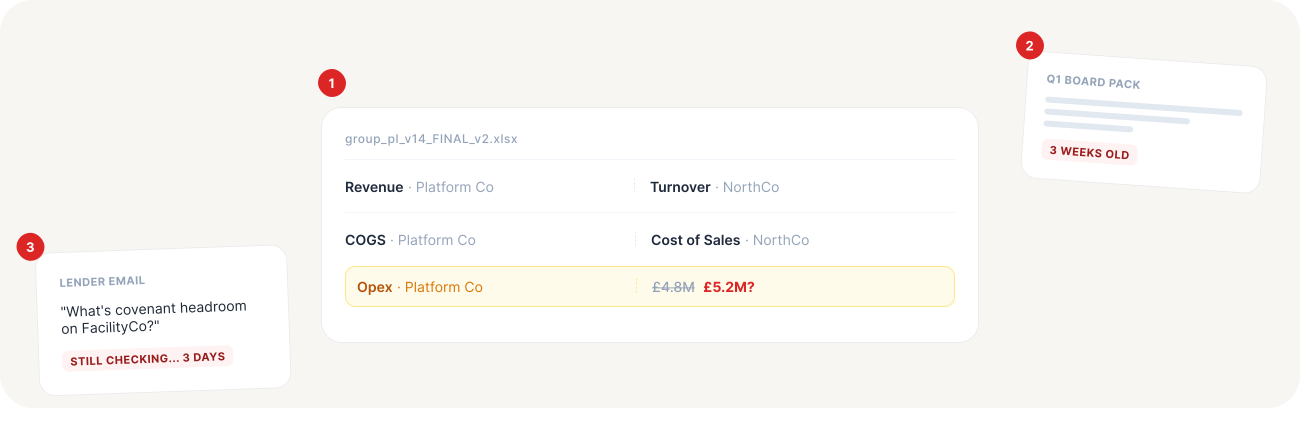
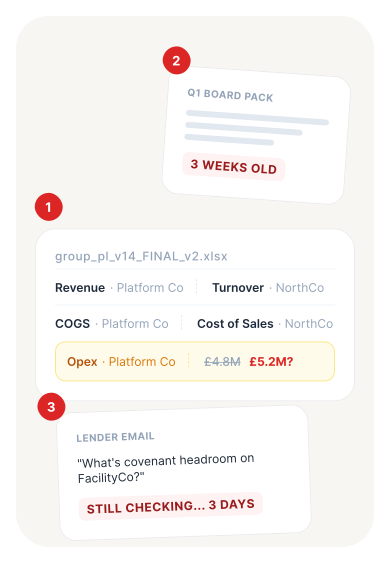
A group P&L spreadsheet with mismatched entity rows, a three-week-old board pack and an unanswered lender emailA group P&L spreadsheet with mismatched entity rows, a three-week-old board pack and an unanswered lender email
01

Different charts of accounts.

Someone reconciles them by hand every month.

02

Board packs built in a rush.

Out of date by the time they're read.

03

Lenders ask questions you can't answer fast.

Covenants, cash, per-entity margin.

Plug in what you already run.

200+ pre-built connectors for accounting, CRM and operations systems. Your entities keep working exactly as they do today.

PMI Stack in the centre, connected to Xero, NetSuite, Sage, Stripe, Dynamics 365, Salesforce, HubSpot, Excel and more

One finance layer. Every deal in focus.

Group revenue, EBITDA, cash and leverage. Live.

One page your board can read: reported vs same-store growth, revenue bridge, covenant headroom, synergy health.

Group revenue trend with the FacilityCo and Madrid Pest acquisitions marked, and a group revenue card showing £69.5m, up 4.1% on the prior period
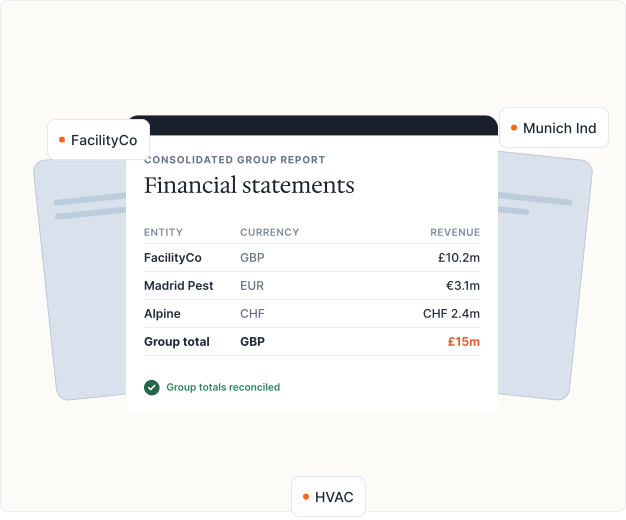
Consolidated group report listing FacilityCo, Madrid Pest and Alpine in GBP, EUR and CHF, with group totals reconciled

P&L, cash flow and balance sheet, consolidated. Then checked.

Group, vertical or entity. Any period. Every consolidated figure is tied back to the entity statements it came from, on a page you can open.

Every deal tracked against what you underwrote.

Revenue, EBITDA and headcount vs the IC memo. Synergies with a named owner. Integration gates at day 1, 30, 100 and 365.
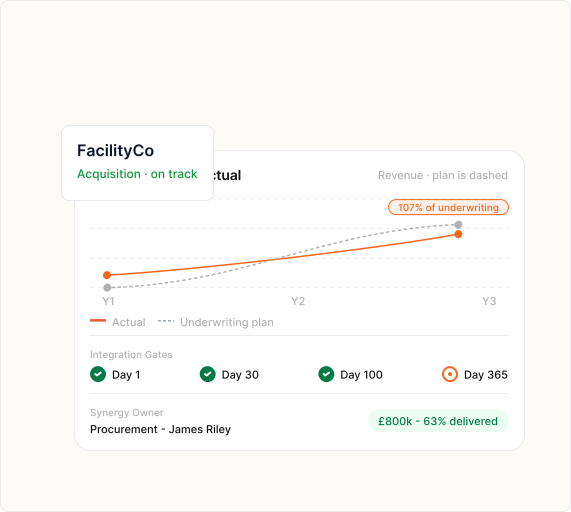
Underwritten versus actual revenue chart at 107% of underwriting, with integration gates at day 1, 30 and 100 completed
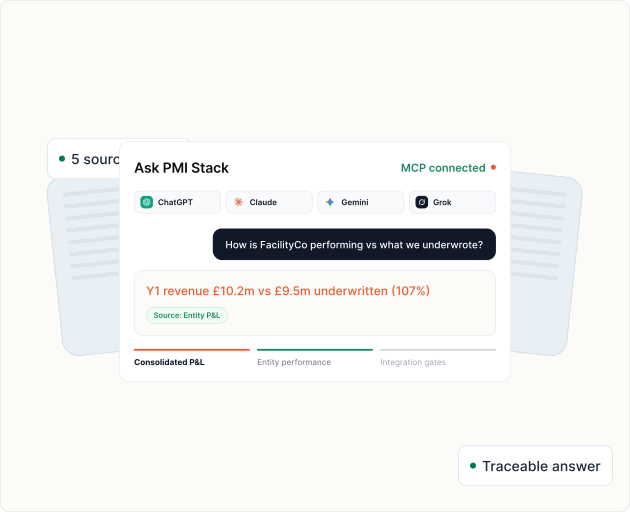
Ask PMI Stack chat with ChatGPT, Claude, Gemini and Grok connected through MCP, answering with a figure traced to source

Ask a question. Get a number that traces to source.

Answered in seconds from your data, in the dashboard or from Claude Desktop and Cursor through MCP. The assistant never does arithmetic and never invents a figure.

Live demo

Try it yourself.

A working dashboard on a fictional 10-entity group. Hover, click, look around.
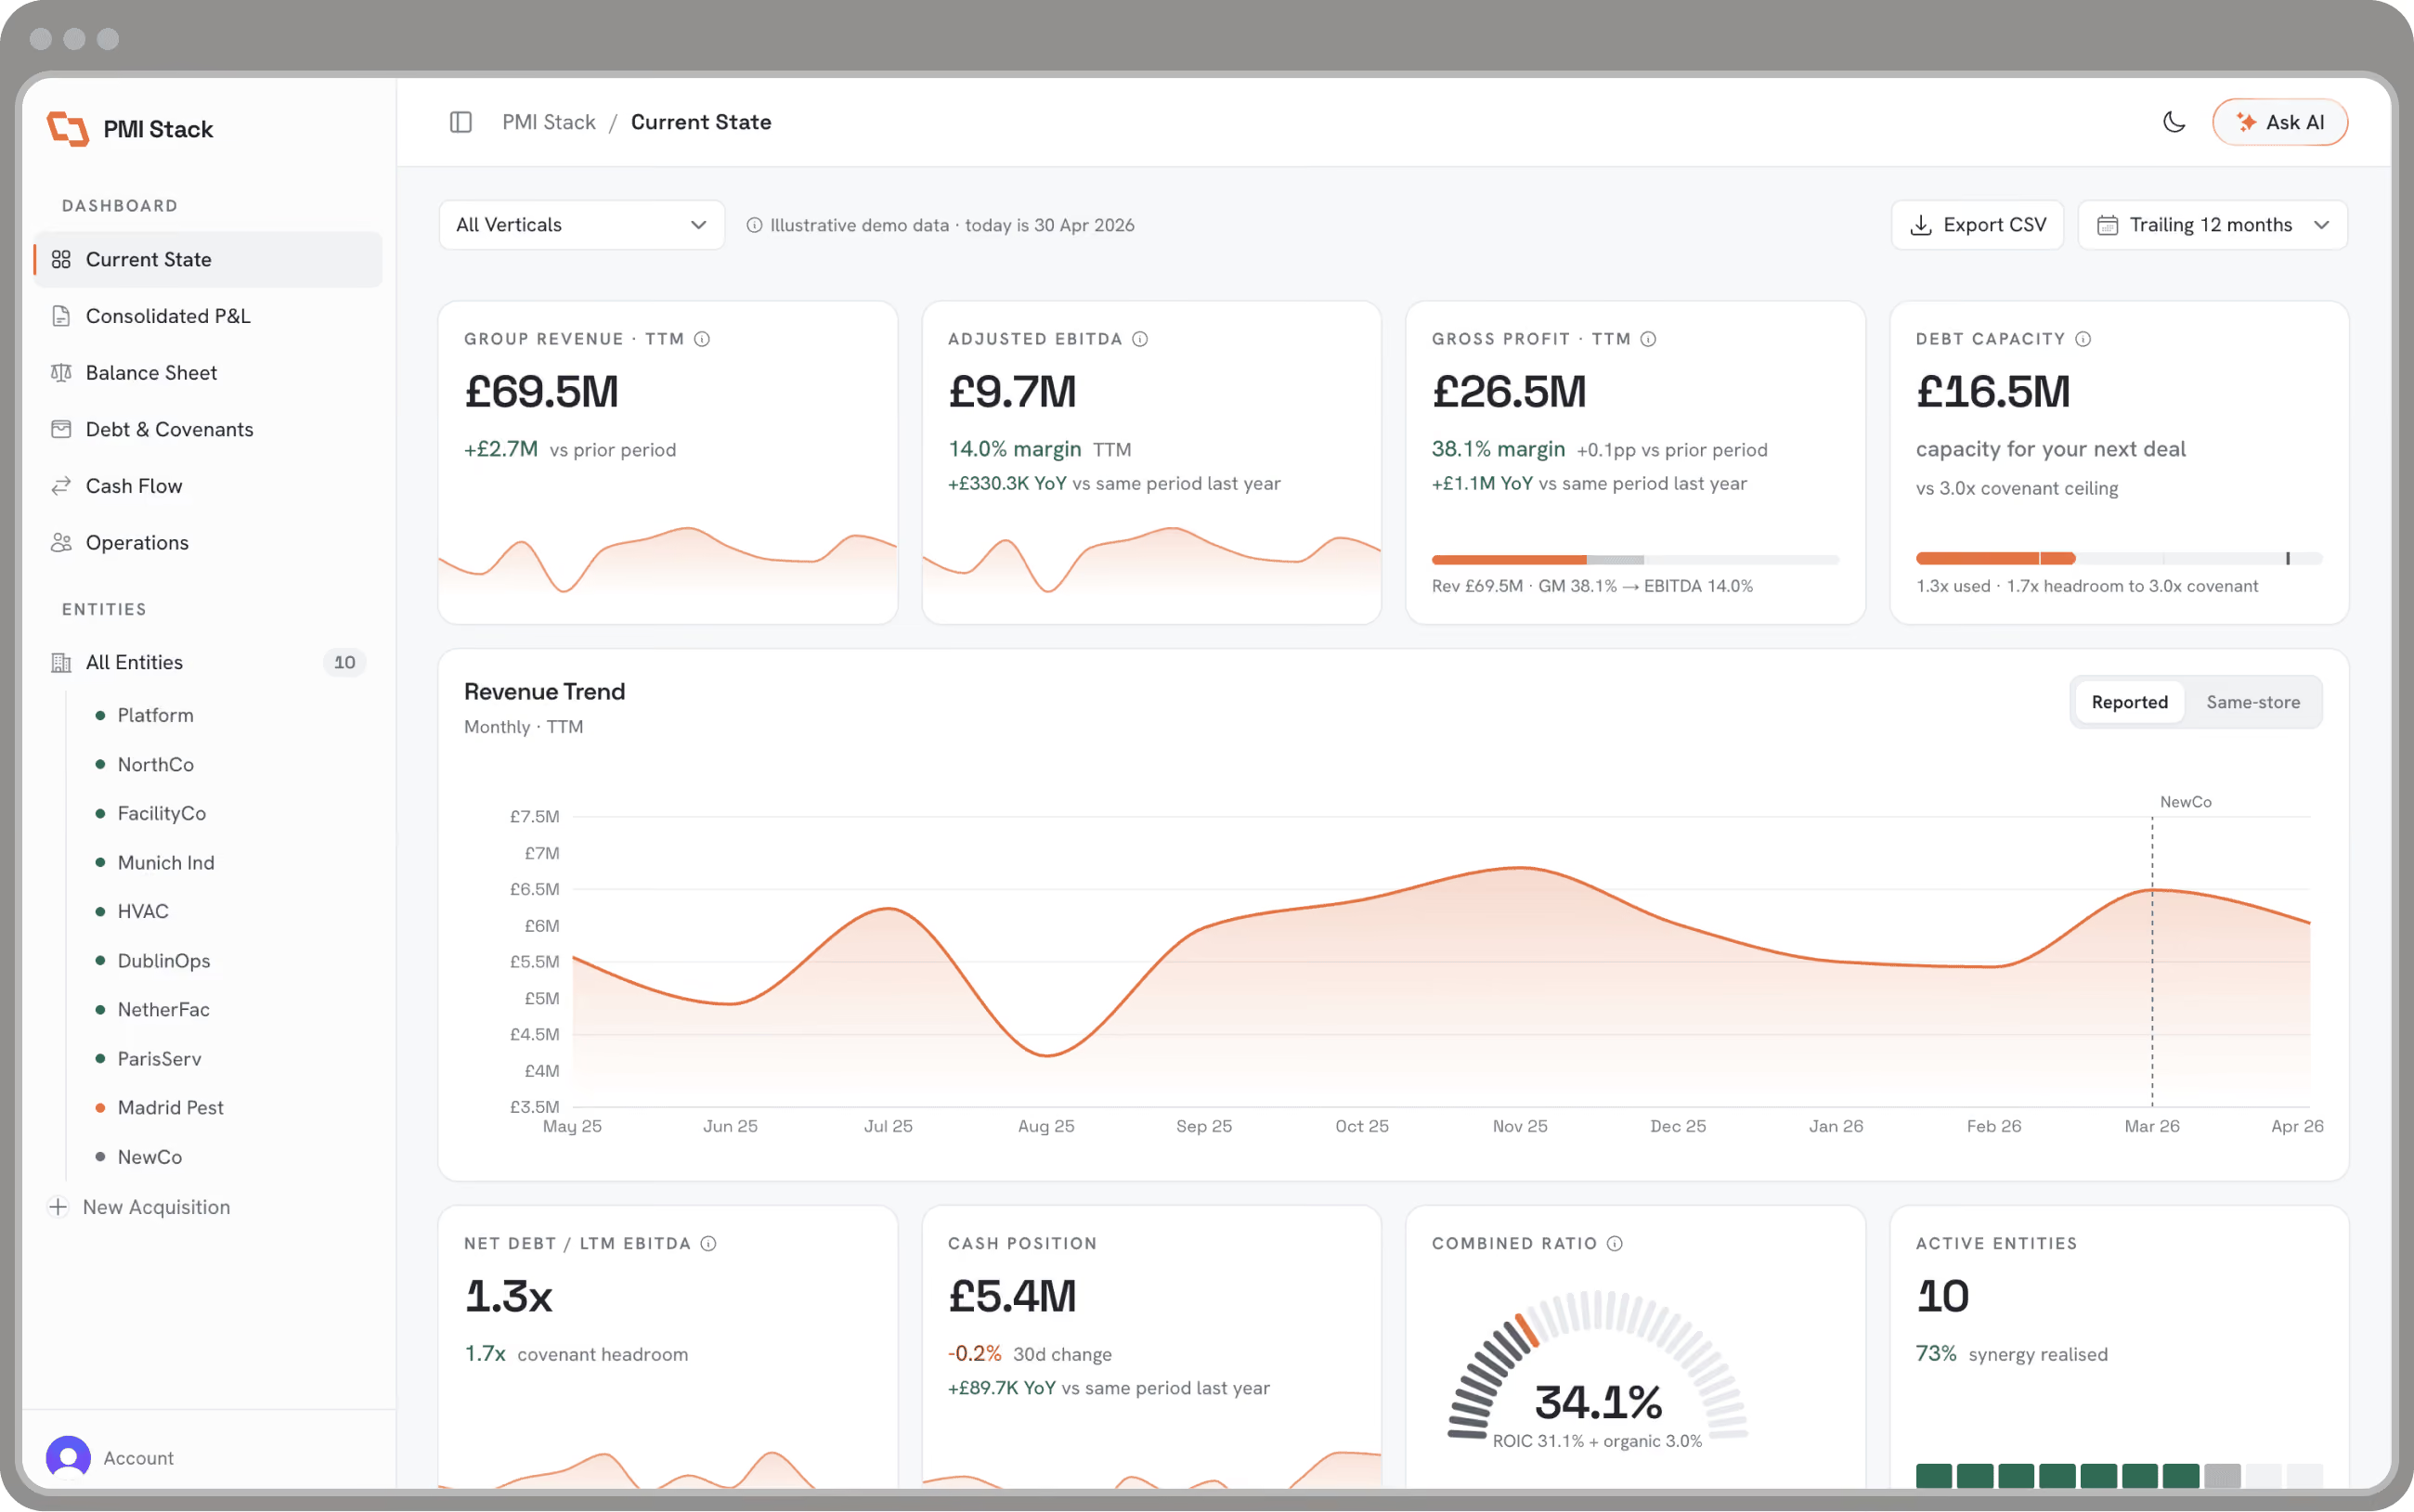
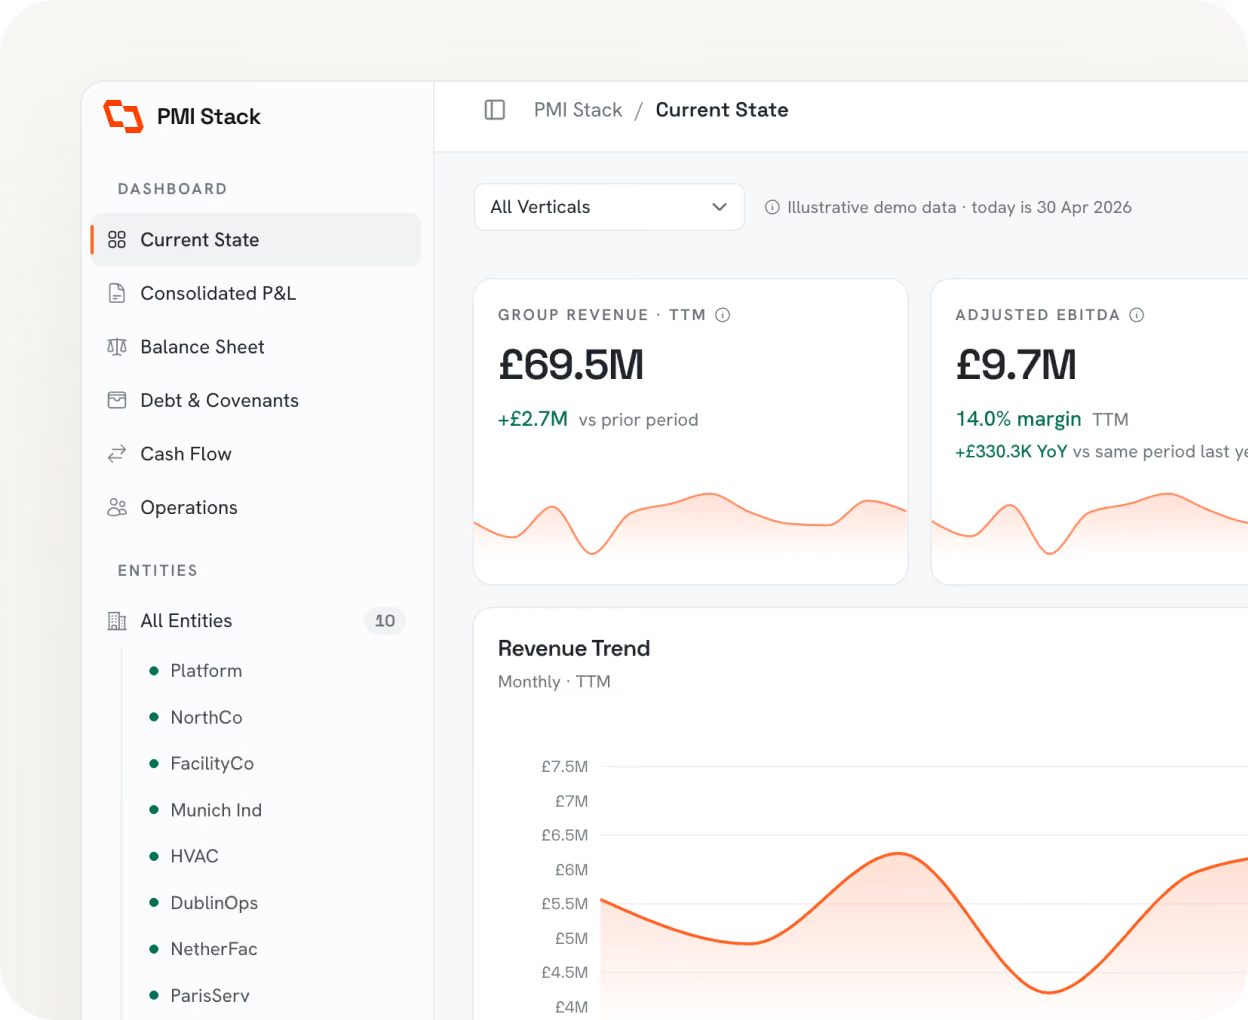
The PMI Stack demo dashboard in a browser window: group revenue, gross profit, EBITDA and cash for a fictional 10-entity group with a revenue trend chart
Live demo

See the whole dashboard.

Approved within one business day
Access to the full demo is approved within one business day.

The reporting that gets you financed.

From first call to live dashboard.

stage
01

Call

30 minutes on your entities, systems and what the board needs to see.

duration
30 min
stage
02

Diagnostic

We map every system and agree the metrics with your finance owner. Fixed fee, credited against the build.

duration
2-3 weeks
stage
03

Build

Connect, map to one chart of accounts, go live.

duration
6-10 weeks
stage
04

Run

We maintain it. Each new acquisition plugs into the same dashboard in days.

duration
Ongoing
Fixed fees at each step. No hourly meter.

Built on your numbers, not a template.

Chart of accounts mapped by finance people.

Not a dropdown you configure yourself.

Your data, in a warehouse you own.

If we ever part ways, you keep every number.

Your next acquisition, connected in days.

The reporting holds as you grow.
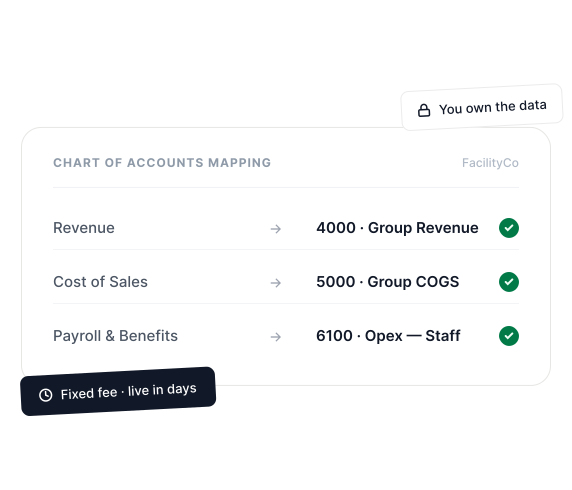
Chart of accounts mapping for FacilityCo: Revenue, Cost of Sales and Payroll mapped to group accounts, with badges reading You own the data and Fixed fee, live in days
RIVR8

Chart-of-accounts standardisation, eliminations and period close are handled by Rivr8, our consolidation finance partner. Already have a CFO who owns this? We work with them instead.

Spreadsheets break. Enterprise software doesn't bend.

Spreadsheets
Self Serve
Enterprise
Spreadsheets
Self-serve reporting tools
Enterprise consolidation software
Connects to any accounting system (200+ connectors)
No
Spreadsheets
No
Self-serve reporting tools
Yes
Enterprise consolidation software
Yes
PMI Stack
Tracks each deal vs underwriting
No
Spreadsheets
No
Self-serve reporting tools
No
Enterprise consolidation software
Yes
PMI Stack
Ask in plain language, every figure traced to source
No
Spreadsheets
No
Self-serve reporting tools
No
Enterprise consolidation software
Yes
PMI Stack
Less than a finance analyst, not an enterprise licence
Yes
Spreadsheets
Yes
Self-serve reporting tools
No
Enterprise consolidation software
Yes
PMI Stack
Done-for-you setup and maintenance
No
Spreadsheets
No
Self-serve reporting tools
No
Enterprise consolidation software
Yes
PMI Stack
Self-serve reporting tools means Fathom, Syft, Joiin and similar: good for a small group on Xero or QuickBooks, as long as you configure and maintain it yourself. Enterprise consolidation software means LucaNet, OneStream and similar: strong products, built and priced for large finance teams with a system implementer on hand.

Common questions

Do our entities need to change systems?
No. We connect to whatever they already use.
How long until it's live?
First build is typically 8-10 weeks after the diagnostic. Adding an entity later takes days, not months.
Can I trust numbers from an AI?
The assistant never calculates or invents a figure. Every number comes from the same queries that power the dashboard and traces back to source. If it can't answer from your data, it says so.
Is this software or a service?
Both. You get a dashboard that looks and works like software. We build it on your data, maintain it, and connect each new acquisition. There is nothing to configure yourself.
What does it cost?
A fixed-fee diagnostic, a fixed build fee based on entity count, then a monthly retainer plus a per-entity fee for each new acquisition. Most groups pay less than one finance hire a year. We quote after the diagnostic.
Can we use it outside the dashboard?
Yes. The same data is available through MCP, so your team can ask questions from Claude Desktop or Cursor and pull live figures into a board note.
What happens to our data if we leave?
You keep the warehouse and every number in it. Dashboard access ends. Any competent BI team can pick it up.

See the live dashboard.

A working demo on a fictional 10-entity group. Click around, ask the assistant anything. Access approved within one business day.

We approve requests manually and never share your details.

Thanks, you're in the queue.

We'll send your demo link within one business day. If you'd rather not wait, book a 30-min call and we'll walk you through it live.

Oops! Something went wrong while submitting the form.

Prefer to talk first? Book a 30-min call
Access approved card for NorthCo Group with Xero and NetSuite synced, a scheduled 30-minute call and a badge reading Approved in under one business day