
Download our Free Roll-Up Integration Playbook
Step-by-step integration checklists
Real mistakes that derail rollups
Proven templates you can use immediately
Built from interviews with 20+ rollup operators
We connect your existing accounting, CRM, and operational systems into one live dashboard - built around how you actually need to report. No system changes. No disruption.
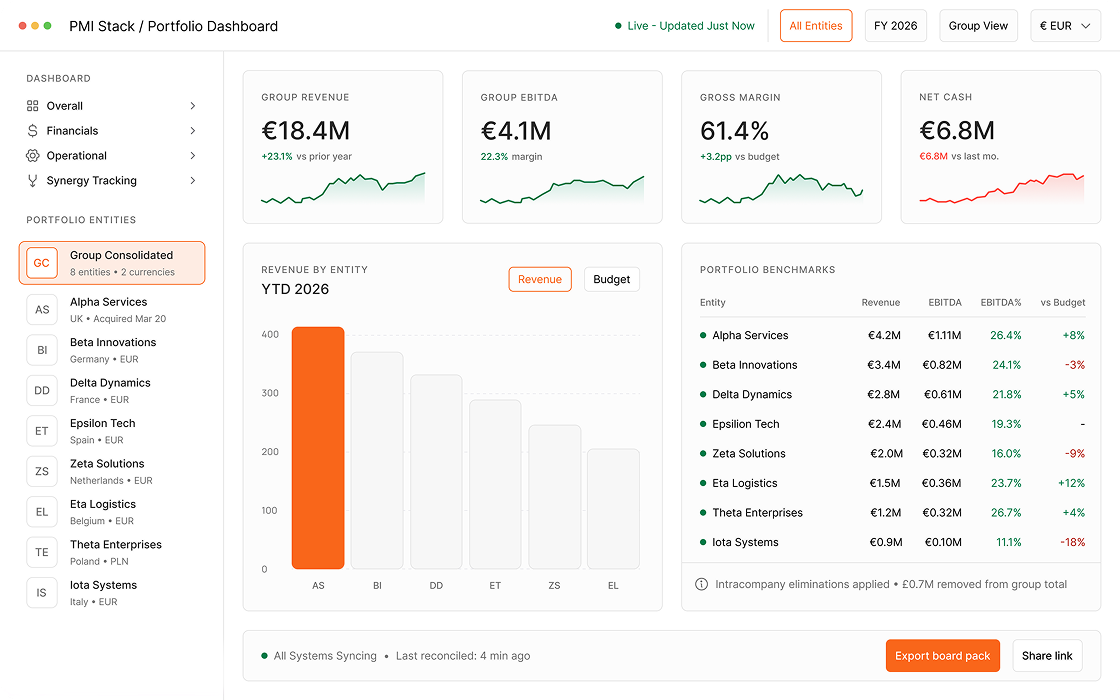
Live financial data pulled directly from your entities' accounting systems. No exports, no mapping, no reconciliation.
.png)
.png)
Financial data only tells half the story. We pull operational metrics from your CRM, HR, billing, and payment systems so you see the full picture.
Compare, benchmark, and track performance across every entity in your portfolio. Built for board reporting and capital conversations.
.png)
This is not off-the-shelf software. We build and maintain your reporting layer as a service - configured to your portfolio structure, your reporting cadence, and the metrics that matter to your investors.
Your entities run different accounting systems, work with different external accountants, and follow different charts of accounts. Getting a consolidated view means someone on your team manually exports, maps, and reconciles - every month, every quarter, every board meeting.
Off-the-shelf tools don't solve it. They're expensive, rigid, and most just summarize raw data without properly consolidating it. They don't connect to your CRM or HR systems. They don't handle your specific chart of accounts. And they don't adapt to how your portfolio is actually structured.
You need something built around your business, not a tool you have to build your business around.
Live data from every entity, automatically. No more Excel marathons before every close.
Entity-level trends, margin shifts, and operational KPIs - all filterable and comparable.
New acquisitions connect to the same dashboard. The reporting holds as you grow.
Consolidated financials and KPIs available on demand, not assembled in a rush.
Real-time visibility across the portfolio builds trust and makes capital conversations easier.
Compare entity performance against targets and each other. Know where to invest and where to intervene.
We connect to your existing systems. No migrations, no disruption, no changes to how your entities operate.
Consolidated financials and KPIs available on demand, not assembled in a rush.
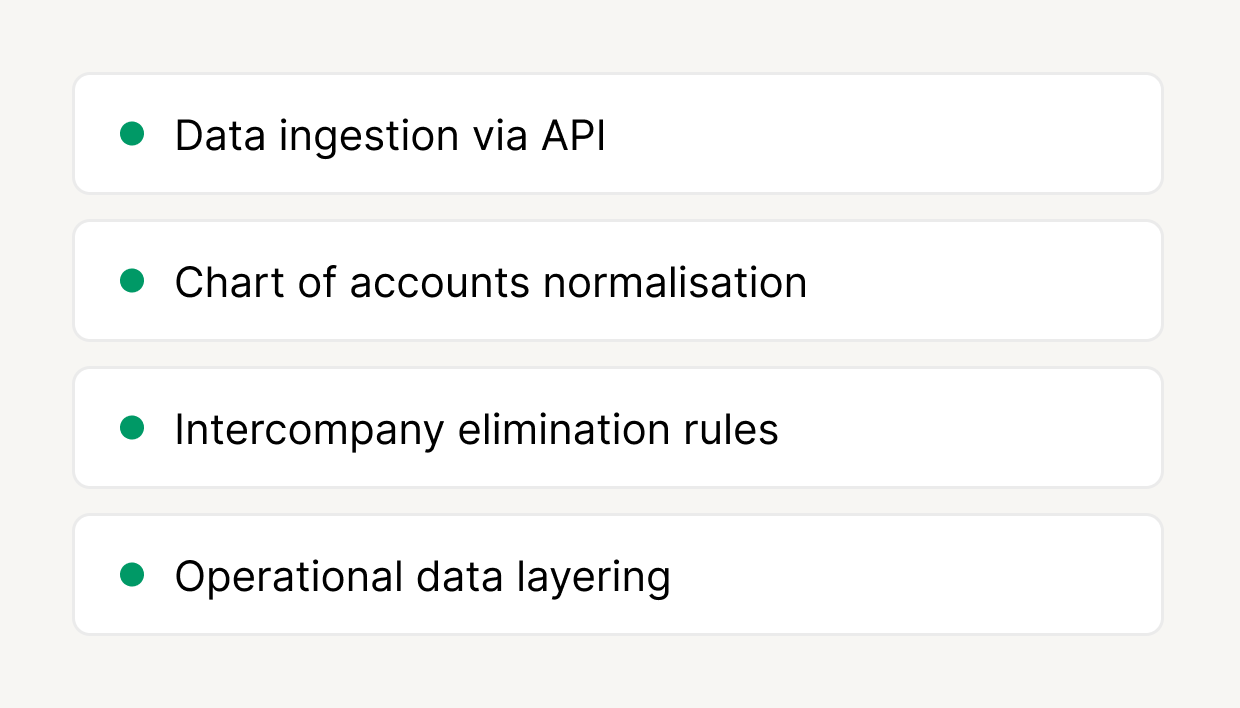
Financial data flows into a central warehouse, accounts are normalized, intercompany transactions removed, and CRM, HR, and billing data layered in.
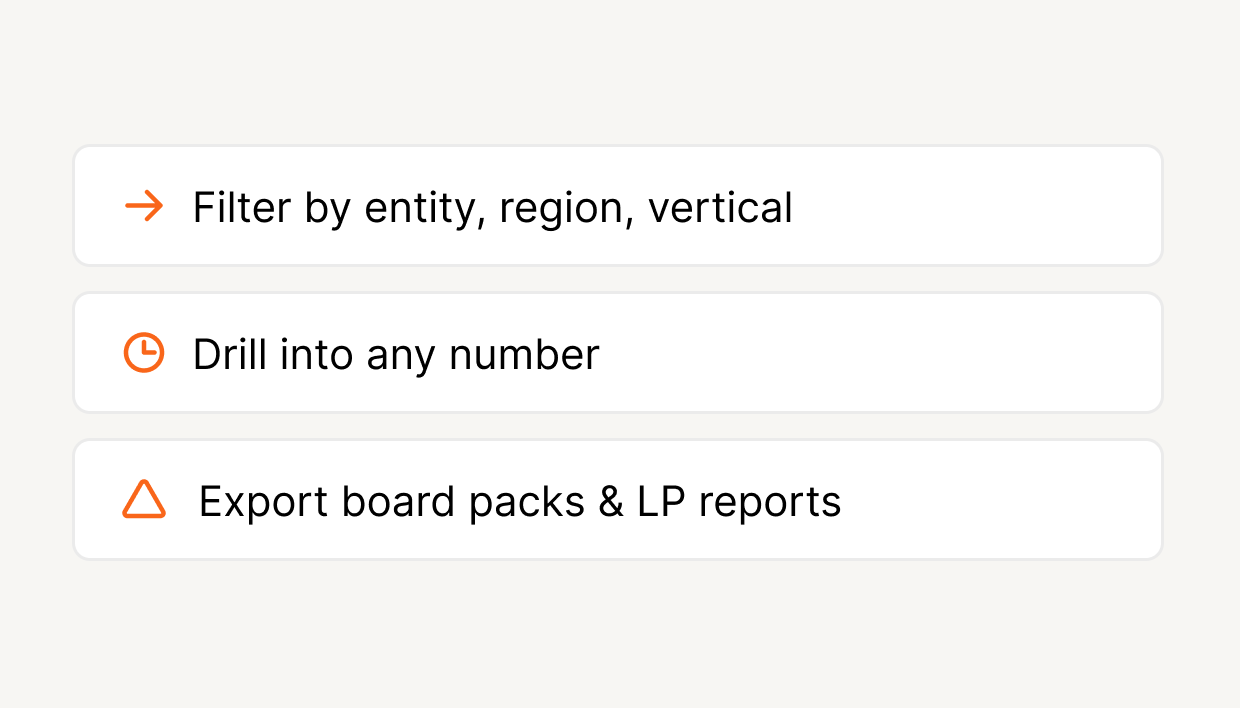
Live dashboards tailored to your reporting. Filter by entity, vertical, region, or time. Drill into any metric. Export for board and LP reports.

Scope and timeline depend on your portfolio - number of entities, systems involved, data quality, and reporting complexity. Here's the process we follow.
If you need support on the financial side, we work with PPHF, a fractional CFO practice built for roll-ups, led by Pavleta Pavlova. They handle the financial architecture: chart of accounts standardisation, intercompany eliminations, HoldCo-level due diligence and tax planning, and the reporting layer your board and investors actually need.
If your finance team already owns this, we work with them directly. Either way, the financial logic and technical delivery are built together from day one.

“The most expensive mistake a roll-up makes is not standardizing the chart of accounts early. It blows up at audit time - suddenly you're trying to reconcile multiple definitions of revenue and margin across entities, under pressure, with scrutiny from external parties.”

Once you have the full picture, you might decide to go further - unifying CRMs, ERPs, and workflows across your acquisitions so the group runs as one company, not ten. That's System Unification, and it's the natural next step when you're ready.
No. We connect to whatever they're already using. Your entities keep operating exactly as they are.
It's a service. We build and maintain your reporting layer for you - the data warehouse, the pipelines, and the dashboards. You own the data and the infrastructure. We handle the technical work.
No. If your finance team can define the chart of accounts mapping and reporting requirements, we work directly with them. PPHF is available if you need financial architecture support, but it's not required.
Yes. We pull data from CRM, HR, billing, and payment systems alongside accounting data. Most groups start with financials and layer in operational KPIs once the core reporting is stable.
We've seen groups try tools like Join, Fathom, and others. They're typically expensive, rigid, and don't properly consolidate across different charts of accounts. Our approach is built around your specific portfolio structure, not a one-size-fits-all template.
We connect the new entity's systems, apply the existing normalization rules, and they appear on the dashboard. Same process, fraction of the time.
It depends on the number of entities, systems involved, data quality, and reporting complexity. We'll give you an honest estimate after scoping.
A 30-minute discovery call is all it takes to understand what's possible. We'll look at your current systems, talk through your reporting needs, and map out what a consolidated view looks like for your specific portfolio.
No pitch. No pressure. Just a clear picture of what it takes.
Thanks for reaching out. We will review your submission and get back to you within 24–48 hours.